Neorrenascença

Multi tool use
|
Esta página ou secção não cita fontes confiáveis e independentes, o que compromete sua credibilidade (desde fevereiro de 2013). Por favor, adicione referências e insira-as corretamente no texto ou no rodapé. Conteúdo sem fontes poderá ser removido. —Encontre fontes: Google (notícias, livros e acadêmico)
|
|

Prefeitura de Hamburgo (Alemanha), edifício neorrenascentista de caráter germânico construído entre 1884 e 1887.
Neorrenascença ou Neorrenascimento é um estilo artístico revivalista surgido no século XIX. O estilo manifestou-se principalmente na arquitetura, estando filiado à arquitetura historicista, mas também influenciou as artes decorativas. Como indica o nome, o estilo retomava as formas arquitetônicas e decorativas do Renascimento europeu dos séculos XIV, XV, XVI e princípios do XVII.
A arquitetura renascentista original caracterizou-se por uma grande variedade de formas dependendo da época e do país. De maneira similar, a arquitetura neorrenascentista teve inúmeras vertentes, dependendo das fontes de inspiração serem o renascimento italiano, francês, germânico, inglês ou outro. Devido a isso é difícil definir características em comum do estilo, podendo-se considerar que existiram vários estilos neorrenascentistas.
Outro fator importante é que, frequentemente, os projetos misturavam elementos da arquitetura neorrenascentista com o neogótico, o neoclassicismo e o neobarroco, dando origem a edificações ecléticas. Assim, obras importantes como a Ópera Garnier (1861-74) de Paris e a Ópera Semper (1871-78) em Dresden são uma mistura de renascença, barroco e neoclassicismo.
Alguns dos modelos mais comuns para a arquitetura neorrenascentista foram os palazzi renascentistas italianos como o Palácio Pitti em Florença e o Palácio Farnese em Roma. Na vertente francesa foram modelos châteaux como o Palácio de Chambord e o Palácio de Blois, localizados no vale do rio Loire. Na Alemanha e norte da Europa serviram de modelos as várias prefeituras (Rathäuser) e palácios dos séculos XVI e XVII, enquanto que na Inglaterra os modelos comumente usados foram as casas de campo e palácios do período isabelino.
Galeria |
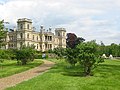
Château de Ferrières (1855-59), em estilo da renascença inglesa, França
Mentmore Towers (1852-54), Inglaterra
Palácio Vladimir (1867-72), São Petersburgo, Rússia
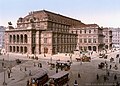
Ópera Estatal de Viena (1861-69), Áustria
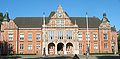
Edifício do Museu Nacional de Belas-Artes da Suécia (c.1866)
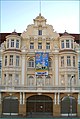
Prefeitura do distrito de Harburg (c.1889), Hamburgo, Alemanha
Escritório Regional em Estetino (Pomerânia Ocidental), Polónia
Teatro Municipal de São Paulo (1903-11), Brasil
Edifício Ely (1922) em Porto Alegre, Brasil.
Ver também |
- Arquitetura historicista
- Arquitetura eclética
- Revivalismo
 |
Este artigo sobre arquitetura é um esboço. Você pode ajudar a Wikipédia expandindo-o.
|
 |
Este artigo sobre arte ou história da arte é um esboço. Você pode ajudar a Wikipédia expandindo-o. |
kOJSdXfwTsWOb 0BFFBuc3kbJ0yAFmh9cj5BXcwTvV6L0O
Popular posts from this blog
1
This question is a follow up of this one. I am trying to run a command through the command line on a remote machine running Windows 7 from a workstation running Debian in an SSH session on that machine. The setup is basically as follows: debian box 1 === (SSH) ===> debian box 2 === (RDP) ===> Windows 7 I have tried running rdesktop from debian box 2 : rdesktop <Windows 7 box network address> -u username -p password -r disk:local="./TestRDP" -s "cmd.exe /K net use C: \\tsclientlocal & C:\test.bat & logoff" but cmd.exe is not launched on the remote device. I have also tried to open up cmd.exe on its own: rdesktop <Windows 7 box network address> -u username -p password -s "cmd.exe" but the terminal is not launched upon login ( rdesktop successf...
3
Assumed I want to draw three simple graphs based on the following illustration: How can I plot those three graphs? I've tried to create something like this: Minimum Working Example (MWE): documentclass{standalone} usepackage{pgfplots} begin{document} begin{tikzpicture} begin{axis}[domain=0:1] addplot+[no marks, samples=100] {exp(3*x)}; addplot+[no marks, samples=100] {(-exp(3*x)+20)}; end{axis} end{tikzpicture} end{document} Screenshot of the current state: Description of the issue: However, I don't get the point on how to figure out the function of the third graph as well as how to clip the graphs in x and y direction to align them centered in the plot. It is not necessary to be completely precise, the accuracy of my upper template w...
up vote
0
down vote
favorite
So, my friend has been trying to install Matlab 2018b and he has encountered the following message just after the installation reaches 100%. Matlab installation additional configuration steps message I did some digging around in the Matlab forums and found out that to use the additional components, one should install a compiler and then use the following commands: mex -setup C mex -setup C++ Can anyone help me regarding this error? If this is indeed the solution then how can I execute those steps? Also, he says that even if he presses next, he cannot use matlab. The OS in use is Windows 10.
installation matlab
share | improve this question
...