Monte San Vito
| ||||
|---|---|---|---|---|
Comuna | ||||
 | ||||
 | ||||
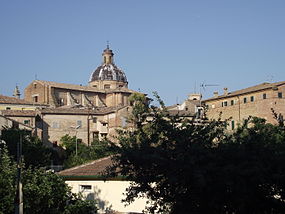
 Monte San Vito Localização de Monte San Vito na Itália | ||||
| Coordenadas | ||||
Região | ||||
Província | Ancona | |||
Área | ||||
| - Total | 21 81 km² | |||
Altitude | 135 m | |||
População | ||||
| - Total | 6 800 (30-11-2 017) | |||
• Densidade | 311,78 hab./km² | |||
| Outros dados | ||||
| Comunas limítrofes | Chiaravalle, Jesi, Monsano, Montemarciano, Morro d'Alba, San Marcello, Senigália | |||
| Código ISTAT | 042030 | |||
Código postal | 60037 | |||
| Prefixo telefônico | 071 | |||
| Sítio | www.comune.montesanvito.an.it | |||
Monte San Vito é uma comuna italiana da região dos Marche, província de Ancona, com cerca de 5 530 habitantes. Estende-se por uma área de 21 km², tendo uma densidade populacional de 263 hab/km². Faz fronteira com Chiaravalle, Jesi, Monsano, Montemarciano, Morro d'Alba, San Marcello, Senigália.[1][2][3]
Demografia |
| Variação demográfica do município entre 1861 e 2011[3] |
 |
| Fonte: Istituto Nazionale di Statistica (ISTAT) - Elaboração gráfica da Wikipedia |
Referências
↑ «Statistiche demografiche ISTAT» (em italiano). Dato istat
↑ «Popolazione residente al 31 dicembre 2010» (em italiano). Dato istat
↑ ab «Istituto Nazionale di Statistica» 🔗 (em italiano). Statistiche I.Stat
Ligações externas |
Sítio oficial (em italiano)


