Coordenadas: 5° 30' S 34° 30' E
Singida
|
Capital
|
Singida
|
População
|
1,370,637[1] habitantes
|
Censo
|
2012
|
Área
|
49.341 km²
|
Densidade
|
28 hab/km²
|
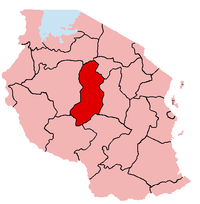
Mapa
|
|
Singida é uma região da Tanzânia. Sua capital é a cidade de Singida.
Distritos |
- Iramba
- Manyoni
- Singida Rural
- Singida Urban
Referências
↑ Tanzania National Bureau of Statistics, 2012 Population and Housing Census
 |
Este artigo sobre Geografia da Tanzânia é um esboço. Você pode ajudar a Wikipédia expandindo-o. |
Regiões da Tanzânia
|

|
|---|
Arusha |
Dar es Salaam |
Dodoma |
Geita |
Iringa |
Kagera |
Kagera |
Kigoma |
Kilimanjaro |
Lindi |
Manyara |
Mara |
Mbeya |
Morogoro |
Mtwara |
Mwanza |
Njombe |
Pemba North |
Pemba South |
Pwani |
Rukwa |
Ruvuma |
Shinyanga |
Simiyu |
Singida |
Songwe |
Tabora |
Tanga |
Zanzibar South |
Zanzibar North |
Zanzibar West
|
ver • editar
|
