Seward (Alasca)
Seward | |
|---|---|
Localidade dos Estados Unidos | |
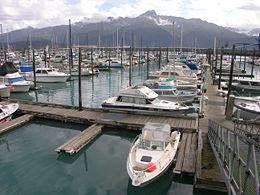
 Visão aérea da cidade | |
 Seward | |
 Seward | |
| Localização | |
Borough | Distrito de Kenai Peninsula |
Estado | |
| Tipo de localidade | Cidade |
| Características geográficas | |
Área | 37,4 km² |
| - água | 18,4 km² |
População (2006) | 3 025 hab. (81 hab./km²) |
| Códigos | |
código FIPS | 68560 |
Seward é uma cidade localizada no estado americano de Alasca, no Distrito de Kenai Peninsula.
Índice
1 Demografia
2 Geografia
3 Localidades na vizinhança
4 Referências
5 Ligações externas
Demografia |
Segundo o censo americano de 2000, a sua população era de 2830 habitantes.[1]
Em 2006, foi estimada uma população de 3025,[2] um aumento de 195 (6.9%).
Geografia |
De acordo com o United States Census Bureau tem uma área de
55,8 km², dos quais 37,4 km² cobertos por terra e 18,4 km² cobertos por água.
Localidades na vizinhança |
O diagrama seguinte representa as localidades num raio de 48 km ao redor de Seward.

Referências
↑ U.S. Census Bureau. Census 2000 Summary File 1
↑ U.S. Census Bureau. Estimativa da população (julho de 2006)
Ligações externas |
- Estatísticas, mapas e outras informações sobre Seward em city-data.com


