Hoya de Buñol
| ||||
|---|---|---|---|---|
Comarca | ||||
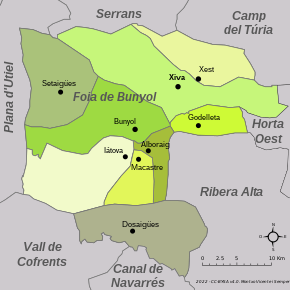 Mapa da comarca. | ||||
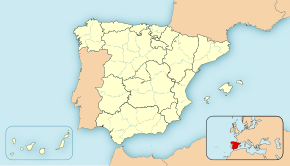 Hoya de Buñol Localização de Hoya de Buñol na Espanha | ||||
| Coordenadas | ||||
Comunidade autónoma | Comunidade Valenciana | |||
Província | Valência | |||
Capital | Chiva | |||
| Área | ||||
| - Total | 817,37 km² | |||
População | ||||
| - Total | 42 796 | |||
• Densidade | 52,4 hab./km² | |||
| Nº de municípios | 9 | |||
Hoya de Buñol (em castelhano e oficialmente; em valenciano: Foia de Bunyol) é uma comarca situada no centro da Comunidade Valenciana, na Espanha. Sua capital é o município de Chiva. Limita com as comarcas de Horta Oest, Requena-Utiel, Los Serranos, Camp del Túria, La Canal de Navarrés, Valle de Cofrentes e Ribera Alta[1].
Municípios |
| Município | População | Área | Densidade |
|---|---|---|---|
| Chiva | 14 758 | 178,73 | 83,95 |
| Buñol | 9 618 | 112,40 | 86,53 |
| Cheste | 8 471 | 71,44 | 118,41 |
| Godelleta | 3 396 | 37,45 | 90,25 |
| Yátova | 2 079 | 120,25 | 17,60 |
| Siete Aguas | 1 223 | 110,59 | 11,59 |
| Macastre | 1 237 | 37,66 | 37,17 |
| Alborache | 1 147 | 27,33 | 41,57 |
| Dos Aguas | 394 | 121,52 | 3,65 |
Referências
↑ «Hoya de Buñol, La». Gran Enciclopedia Temática de la Comunidad Valenciana. Geografía. [S.l.]: Editorial Prensa Valenciana. 2009


