Guarayos (província)

Multi tool use
Nota: se procura pela tribo guarani, veja Guaraios.
Coordenadas: 15° 20' S, 63° 30' O
Guarayos
|

|

|
Brasão
|
Bandeira
|
Capital
|
Ascención de Guarayos
|
Departamento
|
Santa Cruz
|
População
|
31 577 habitantes
|
Censo
|
5 de setembro de 2001
|
Área
|
29 450 km²
|
Densidade
|
1,07 hab/km²
|
População projetada em 2005
|
37 275 habitantes
|
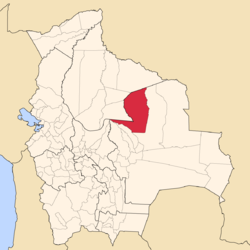
Localização na Bolívia
|

|
Localização no departamento
|

|
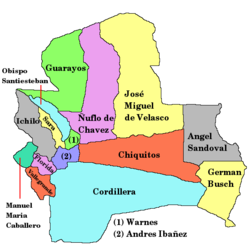
Guarayos é uma província do departamento de Santa Cruz, na Bolívia. Sua capital é a cidade de Ascención de Guarayos.
Topônimo |
O nome da província é uma referência à tribo guarani dos guaraios, que habita até hoje a região.[1]
Referências
↑ Educa. Disponível em http://www.educa.com.bo/etnias/los-guarayos. Acesso em 30 de dezembro de 2016.
 |
Este artigo sobre Geografia da Bolívia é um esboço. Você pode ajudar a Wikipédia expandindo-o. |
Províncias da Bolívia |

|
Departamento de Chuquisaca:
Belisario Boeto |
Hernando Siles |
Jaime Zudáñez |
Juana Azurduy de Padilla |
Luis Calvo |
Nor Cinti |
Oropeza |
Sud Cinti |
Tomina |
Yamparáez
Departamento de Cochabamba:
Arani |
Arque |
Ayopaya |
Bolívar |
Capinota |
Carrasco |
Cercado |
Chapare |
Esteban Arce |
Germán Jordán |
Mizque |
Narciso Campero |
Punata |
Quillacollo |
Tapacarí |
Tiraque
Departamento de El Beni:
Cercado |
Iténez |
José Ballivián |
Mamoré |
Marbán |
Moxos |
Vaca Diéz |
Yacuma
Departamento de La Paz:
Abel Iturralde |
Aroma |
Bautista Saavedra |
Caranavi |
Eliodoro Camacho |
Franz Tamayo |
Gualberto Villarroel |
Ingavi |
Inquisivi |
José Manuel Pando |
José Ramón Loayza |
Larecaja |
Los Andes |
Manco Kapac |
Muñecas |
Nor Yungas |
Omasuyos |
Pacajes |
Pedro Domingo Murillo |
Sud Yungas
Departamento de Oruro:
Atahuallpa |
Carangas |
Cercado |
Eduardo Avaroa |
Ladislao Cabrera |
Litoral |
Nor Carangas |
Pantaleón Dalence |
Poopó |
Puerto de Mejillones |
Sajama |
San Pedro de Totora |
Saucarí |
Sebastián Pagador |
Sud Carangas |
Tomas Barrón
Departamento de Pando:
Abuná |
Federico Román |
Madre de Dios |
Manuripi |
Nicolás Suárez
Departamento de Potosí:
Alonzo de Ibáñez |
Antonio Quijarro |
Bernardino Bilbao |
Charcas |
Chayanta |
Cornelio Saavedra |
Daniel Campos |
Enrique Baldivieso |
José María Linares |
Modesto Omiste |
Nor Chichas |
Nor Lípez |
Rafael Bustillo |
Sud Chichas |
Sud Lípez |
Tomás Frías
Departamento de Santa Cruz:
Andrés Ibáñez |
Ángel Sandóval |
Chiquitos |
Cordillera |
Florida |
Germán Busch |
Guarayos |
Ichilo |
Ignacio Warnes |
José Miguel de Velasco |
Manuel María Caballero |
Ñuflo de Chávez |
Obispo Santistevan |
Sara |
Vallegrande
Departamento de Tarija:
Aniceto Arce |
Burnet O'Connor |
Cercado |
Eustaquio Méndez |
Gran Chaco |
José María Avilés
|
ver • editar
|
Y,jM79A DhpfZJ XwvHKf,EbSQFDvbO,nfWAmjDGl NS5MmsnJjhtoLhRx bD1gPgagJ,F pPo8h,zi,eWDL,kTMKXl,C
Popular posts from this blog
1
This question is a follow up of this one. I am trying to run a command through the command line on a remote machine running Windows 7 from a workstation running Debian in an SSH session on that machine. The setup is basically as follows: debian box 1 === (SSH) ===> debian box 2 === (RDP) ===> Windows 7 I have tried running rdesktop from debian box 2 : rdesktop <Windows 7 box network address> -u username -p password -r disk:local="./TestRDP" -s "cmd.exe /K net use C: \\tsclientlocal & C:\test.bat & logoff" but cmd.exe is not launched on the remote device. I have also tried to open up cmd.exe on its own: rdesktop <Windows 7 box network address> -u username -p password -s "cmd.exe" but the terminal is not launched upon login ( rdesktop successf...
3
Assumed I want to draw three simple graphs based on the following illustration: How can I plot those three graphs? I've tried to create something like this: Minimum Working Example (MWE): documentclass{standalone} usepackage{pgfplots} begin{document} begin{tikzpicture} begin{axis}[domain=0:1] addplot+[no marks, samples=100] {exp(3*x)}; addplot+[no marks, samples=100] {(-exp(3*x)+20)}; end{axis} end{tikzpicture} end{document} Screenshot of the current state: Description of the issue: However, I don't get the point on how to figure out the function of the third graph as well as how to clip the graphs in x and y direction to align them centered in the plot. It is not necessary to be completely precise, the accuracy of my upper template w...
up vote
0
down vote
favorite
So, my friend has been trying to install Matlab 2018b and he has encountered the following message just after the installation reaches 100%. Matlab installation additional configuration steps message I did some digging around in the Matlab forums and found out that to use the additional components, one should install a compiler and then use the following commands: mex -setup C mex -setup C++ Can anyone help me regarding this error? If this is indeed the solution then how can I execute those steps? Also, he says that even if he presses next, he cannot use matlab. The OS in use is Windows 10.
installation matlab
share | improve this question
...