Armstrong (cratera)
Armstrong
| Astro | Lua |
|---|---|
| Coordenadas | 1,35, 24,94 |
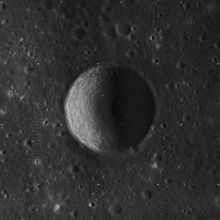
| Diâmetro | 4,21 km |
| Profundidade | 700 m |
| Quadrângulo | LQ12 (d) |
| Tipo | Crateras lunares |
|---|
| Epónimo | Neil Armstrong |
|---|
Localização no mapa de Lua
 |
Armstrong é uma minúscula cratera de impacto na Lua situada na parte sul do Mar da Tranquilidade. Situa-se a cerca de 50 quilómetros a nordeste do local de alunagem da Apollo 11. A Armstrong é a mais oriental da fila de três crateras baptizadas em homenagem aos membros da tripulação da Apollo 11. A norte localiza-se o local de impacto da Ranger 8.
Esta cratera era identificada como Sabine E, antes de lhe ter sido alterado o nome pela IAU, em homenagem ao astronauta estado-unidense Neil Armstrong, o primeiro homem a pôr os pés na Lua.
Ver Também |
- Aldrin (cratera)
- Cratera Collins


