Palma (Maiorca)
| ||||
|---|---|---|---|---|
Município | ||||
 | ||||
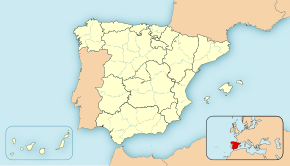 Palma de Maiorca Localização de Palma de Maiorca na Espanha | ||||
| Coordenadas | ||||
Comunidade autónoma | Baleares | |||
Província | Baleares | |||
Área | ||||
| - Total | 213 km² | |||
Altitude | 13 m | |||
População (2008) | ||||
| - Total | 413 781 | |||
• Densidade | 1 942,6 hab./km² | |||
| Gentílico | palmesano, -na; palmesà, -sana | |||
| Código postal | 070XX | |||
| Sítio | www.palma.cat | |||


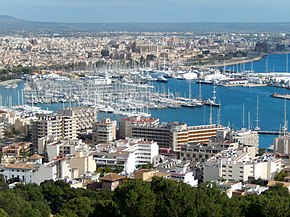
Palma de Maiorca (em castelhano: Palma de Mallorca; em catalão: Palma ou Ciutat de Mallorca) é um município da Espanha
na província e comunidade autónoma das Ilhas Baleares, de área 213 km² com população de 413 781 habitantes (2008) e densidade populacional de 1756,26 hab/km².[1]
Foi fundada pelos romanos com o nome de Palmaria.
Índice
1 Demografia
2 Divisões administrativas
3 Património
4 Transportes
5 Esportes
6 Referências
Demografia |
| Variação demográfica do município entre 1991 e 2004 | |||
|---|---|---|---|
| 1991 | 1996 | 2001 | 2004 |
| 296 754 | 304 250 | 333 801 | 368 974 |
Divisões administrativas |
A cidade de Palma está dividida em cinco distritos:
- Norte
- Centro
- Poente
- Este
- Praia de Palma
Património |
- Portopí - é o terceiro farol mais antigo no activo, atrás da Torre de Hércules e a Lanterna genovesa, e incorpora a mais excepcional colecção de ópticas de farol da Europa[2]
Transportes |
Palma conta com um aeroporto civil e militar situado a 8 km a este do centro: o Aeroporto Internacional de Palma de Maiorca.
Esportes |
O clube de futebol da cidade, o Real Club Deportivo Mallorca, é um dos tradicionais da Espanha. Atualmente disputa a 2ª divisão espanhola, a Liga Adelante, tendo sido rebaixado na última temporada 2012/13.
Referências
↑ «Censo 2011». Instituto Nacional de Estatística (Espanha)
↑ El País. «34 faros espectaculares». 11 de Novembro de 2016. Consultado em 11 de Novembro de 2016.


